
Workflow reference
Picture, inspection & references
Use the controls and worked examples together. Individual sections identify edition-specific tools.
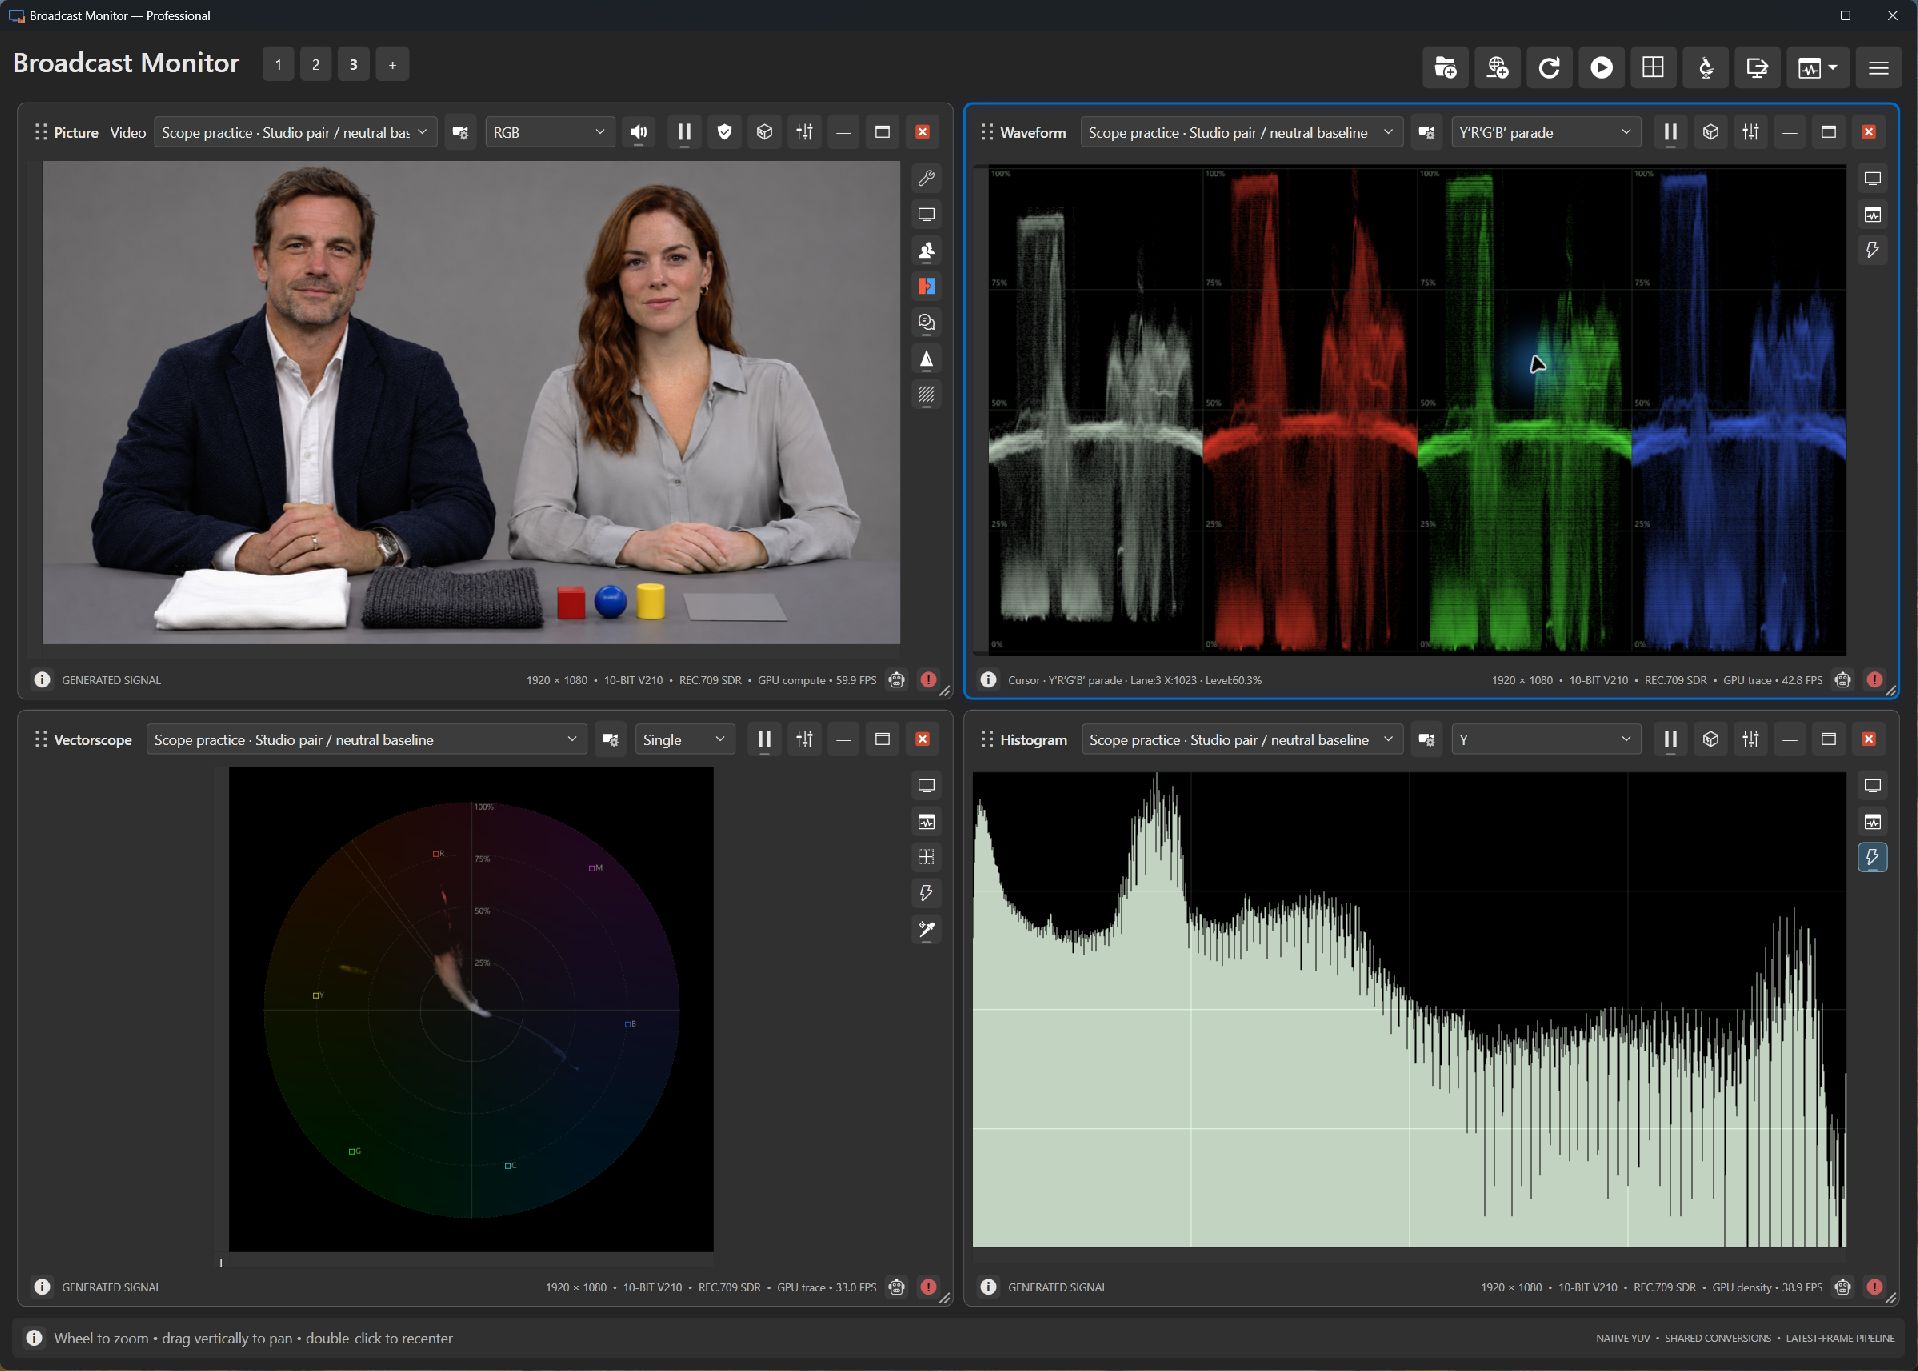
Start with the picture: false color and zebras.
FreeExpressProfessionalRight-click a scope and choose Save Image to retain its selected frame and settings. Choose HD, UHD, square or custom pixel dimensions, then a PNG destination. The scope is rendered again at the chosen resolution without pane controls. Dimensions range from 16 to 8192 pixels, up to 32 megapixels; Picture preserves aspect ratio with black bars when needed. A new render does not preserve accumulated live history or persistence.
False color: make brightness visible
False color replaces the image's normal colors with colors that represent brightness ranges. Instead of trying to judge a face against a bright background, look at the range that face falls into.
Try it during rehearsal: frame your presenter, turn on false color, and observe how the face changes as you adjust exposure. Use the display's scale and your intended look; there is no single exposure value that suits every face or lighting design.
False color is included in all three editions.
Zebras: flag areas that need attention
Zebras place a striped overlay on parts of the image that meet a brightness condition. They make it easy to locate those areas without looking away from the picture.
Try it on a bright stage: use high zebras to see which parts of a white shirt or projection screen cross your selected threshold. A zebra warning invites a closer look; it does not automatically mean the image is clipped.
Free includes high zebras. Express and Professional include all zebra options. For skin-tone zebras and isolation, a hue minimum above the maximum wraps through red at 0 degrees: for example, 350 to 20 degrees. Saturation and optional luminosity limits still apply.
Focus assistance: make fine edges easier to see.
ExpressProfessionalDetail enhancement boosts fine edges in the RGB picture view, with optional grayscale. Adjust its strength to make detail easier to judge, and use the threshold to limit enhancement of low-level noise. Express and Professional include these controls.
During camera setup: maximize the picture pane, enable detail enhancement, and watch fine edges as you adjust focus. Turn it off again to judge the ordinary picture. Enhancement helps reveal detail; it cannot restore detail that the camera did not capture.
Your measurements stay on the source
This is a viewing aid. It does not modify the captured samples or the signal measured by the waveform, vectorscope, or histogram. Zebra thresholds still use source measurements. Pixel Inspector and hover readouts require the complete sample area to be included in analysis; excluded areas report Outside selection.
If you send a composed monitoring layout to an output, its picture pane includes the enhancement. Disable it when you want that output to show the ordinary picture.
Waveform: where is the brightness?
ExpressProfessionalA waveform plots signal level vertically and image position horizontally. Bright parts appear higher on the display; dark parts appear lower. That relationship helps you connect a reading to an area of the picture.
Optional Minimum line, Maximum line, and Average line controls in Scope settings show current-frame component statistics as horizontal guides with numeric readouts in percent (hue in degrees) (blue dotted minimum, orange dashed maximum, yellow solid average). They default off and are saved per pane. Each parade component has its own statistics; all native pixels included in analysis contribute regardless of trace resolution or persistence. An empty analysis selection has no statistics guides or readouts. Average is arithmetic, including for hue; neutral pixels do not contribute hue in Luma/Chroma mode. Guides follow layout, scale, zoom, and pan; clipped guides are hidden while numeric readouts remain visible.
During a live event: check whether a spotlight is pushing a presenter's face much higher than the rest of the scene, or compare black and highlight levels as you move between cameras. Look for lost separation at the extremes, then check the picture as you adjust.
Express includes Y linear-light luminance, Y′ encoded luma, and the Y′CrCb, R′G′B′, and Y′R′G′B′ parades. Professional adds Hue, HSV/HSL Saturation, linear R/G/B, encoded R′/G′/B′, centered Cb/Cr, Chroma Magnitude, and RGB Min, RGB Max / Value, RGB Lightness, and RGB Chroma. Its ordinary Y, Y′, Hue, and HSV Saturation modes use white traces; fixed-color parades provide component-color references.
What is a parade?
A parade separates signal components into displays side by side. An RGB parade, for example, lets you compare the red, green, and blue channels.
On a subject that should be neutral, a channel that sits noticeably higher than the others can help explain a color cast. Use a known neutral subject when matching balance: a red backdrop should have more red, so unequal channels across an entire scene are not automatically a problem.
Production payoff: a more informed starting point for camera matching, especially when cuts reveal brightness or color differences.
Vectorscope: what is the color doing?
ExpressProfessionalA vectorscope shows color as direction and distance from the center. Direction represents hue; distance represents saturation, or how strong the color is. Neutral content stays near the center.
During camera matching: compare the same subject under the same lighting. Does one camera push color in a different direction? Is its color much stronger? The vectorscope helps make those differences visible.
Projection: choose Cb/Cr, Opponent Chroma or Hue–Saturation (HSV). Opponent Chroma projects encoded RGB onto perpendicular colour-opponent axes. Red is up; yellow is upper right. Equal-level RGB/CMY targets form a regular hexagon; the 100% targets have unit displayed radius. Dimming all RGB channels moves the trace inward, unlike HSV saturation. It preserves RGB excursions without clipping; HDR/log remains encoded with no display transform. Radius is neither perceptually uniform saturation nor gamut legality. The 75%/100% targets, Zoom/Gain, Single/Split, colour background and inspection follow this projection. I/Q, the supported skin range and D65 cast-direction guides are transformed into opponent coordinates. Colour-cluster markers follow the same projection; their detection and neutral guidance remain based on native chroma. The live status preview shows normalized Opponent X/Y and chroma radius (100% at the full-level RGB/CMY targets). References use separate opponent X/Y coordinates and save with the pane.
Included in Express and Professional.
Histogram: how is brightness distributed?
ExpressProfessionalEach populated bin is a filled additive bar; overlapping component colors add together. Bin widths follow the received source precision (256 levels for 8-bit, 1024 for 10-bit, 4096 for 12-bit), combining bins when the plot is narrower. Empty bins stay blank without connecting lines. A histogram groups pixels by level. It shows how much of the image falls into dark, middle, and bright ranges, giving you a quick overview of the signal's distribution.
During setup: watch how the distribution changes when the stage lights come up. A concentration at one edge is worth investigating, but it may simply reflect the scene. Unlike a waveform, a histogram does not tell you where those pixels are in the image.
Express includes Y, Y′, and parade histograms. Professional adds combined HSV and the individual components shared with Waveform: linear and encoded RGB, Cb/Cr, hue, HSV/HSL saturation, chroma magnitude, and RGB-derived levels. Count scale changes population height; the horizontal level axis remains linear.
These examples use a built-in sample scene. Explore sample scenes and test patterns without capture hardware, then apply what you learn to your production signal. The guide identifies which editions include each monitoring tool.
Looking for two-source comparison?
Explore chromaticity, Color Balance Plot, and Hue / Saturation.
Inspect the part of the picture that matters.
ExpressProfessionalThe Picture toolbar groups Pan, Pixel Inspector, and Area of Interest tools with display, focus, and exposure controls. Hover over a settings icon to open its flyout. Express and Professional include pixel inspection and a picture face-overlay control. Express and Professional also include held-key face zoom. Professional adds a shared analysis region and local AI Object Selection with separate model setup. Picture Tools offers Rectangle and Ellipse shapes: Rectangle supports Crop or Highlight, while Ellipse highlights selected samples in full-frame scopes. Drag inside the shape to move it or click outside to clear it.
Professional also supports source LUTs and reference overlays. Keep LUT processing intentional: an applied source LUT changes the processed signal supplied to supported measurement views. A reference guide helps compare positions or levels without changing the signal.
Inspect a detail without losing your view.
ExpressProfessionalClick the scope picture or graph to focus its pane before using these shortcuts. Held inspection keys return to your previous view when released; available channels and tools follow your edition.
| Shortcut | Use it for |
|---|---|
| Hold Y, ', R, G, or B | Temporarily inspect linear-light luminance (Y), encoded luma (Y′), or RGB components in Picture, Waveform, and Histogram where available. Hold RGB keys together to combine channels. Hold E for hue and A for saturation where supported. |
| Hold H, S, or M | Expand highlights, shadows, or midtones for a closer look in Picture and supported measurement views. |
| Hold numpad 1–9 | Magnify a region of Picture or a supported scope. The keypad follows screen position: 7/8/9 at the top, 4/5/6 in the middle, and 1/2/3 at the bottom. Regular-keyboard 789 / UIO / JKL mirrors the top / middle / bottom rows. Several held keys average their target centers. |
| Hold Shift, Ctrl, or W | Temporary monochrome, inversion, or uniform white traces in supported views. W uses width 1 and intensity 100%; Audio applies temporary contrast to graphs, with W in Phase/Waveform. |
| Hold Z or numpad + | In Picture, inspect a 2× crop centered on the upper-third line. |
| T; hold Space | In Picture, T cycles the available drag tools. Hold Space to pan temporarily, then release to return to your selected tool. |
| Alt+1–9; Alt+0 | Select the corresponding toolbar view in the targeted pane. Alt+0 selects the tenth view when available. |
| Ctrl+Space | Toggle freeze/resume in a pane with a freeze control. |
Try it with a sample photograph: hold H to inspect a bright stage light, release, then hold R or B to examine its channel contribution. In Picture, add Shift for monochrome or Ctrl to invert the temporary display. These two display modifiers are disabled while Object Selection is active; Ctrl-click still adds to its mask.
For supported graph controls, use the mouse wheel to zoom, Shift+wheel for trace intensity, Ctrl+wheel for trace width, and Ctrl+Shift+wheel for persistence. Alt+wheel cycles available views. Which controls respond depends on the scope and selected mode.
Face zoom and Quad Balance shortcuts · Move between panes and workspaces
Check a neutral patch with white balance guides.
ExpressProfessionalIn Vectorscope, enable White balance guides (D65) for Cb/Cr or Opponent Chroma. The optional guides default off. WARM/COOL and GREEN/MAGENTA describe the observed cast, rather than which way to turn camera controls. Isolate a known neutral gray or white patch and inspect its distance and direction from center.
The guides approximate cast behavior near neutral; they do not measure Kelvin, Duv, or the original illuminant. Camera matrices, mixed lighting, grading, and clipping affect the relationship. They support SDR Rec.709 and Rec.2020; missing tags assume Rec.709 SDR. Explicit Rec.601, HDR/log, and HSV suppress the overlay while retaining the saved preference.